Adding frontend observability to michaellamb.dev
Published on 18 June 2025.
After working with Grafana at my company, I decided to see how far the free accounts stretch. After all, I’ve got an internet domain and reasons to observe it, so why not use Grafana for observability?
What I get from Grafana Faro
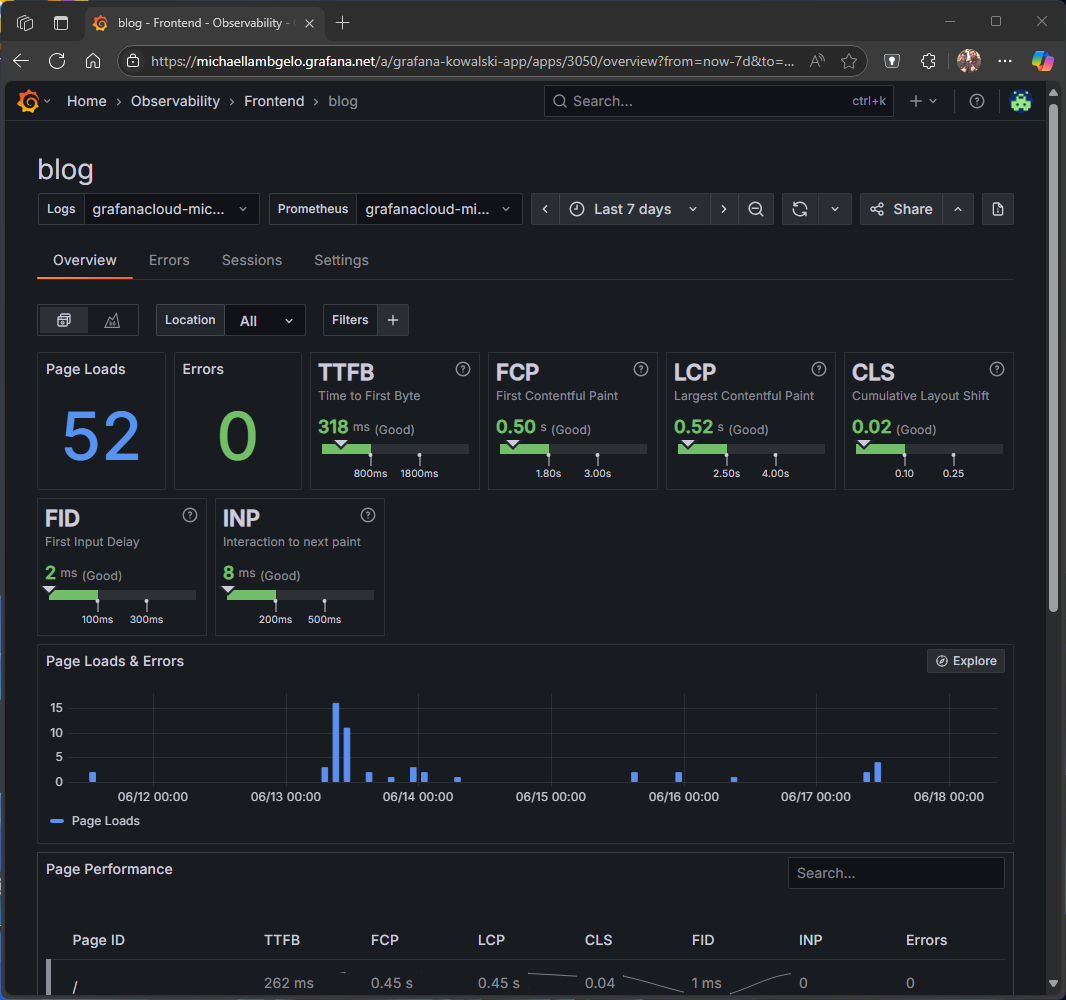
This is the current view of the dashboard with metrics from the blog application I’m observing. It’s activity since my last blog post. Grafana Faro is loaded on the client-side and is blocked by some ad-blockers automatically, yet I get to see how my page performs for an end user for the folks who access my page without one.
Sometimes, users visit a website without an ad-blocker without even realizing it because they’re using something like a social media app and it loads a web browser to keep a user in-app. I’ve noticed most sessions like this are generated from my LinkedIn post advertising last week’s update.
What it took to start using Faro
Grafana makes it very easy to integrate Faro in a frontend app. Either through a web SDK or by importing it through the CDN, anyone can have observability in minutes. Most of the code below is generated within the Grafana dashboard, but I refactored it to work with my development flow. I have observability segmented by environment, so I can see how my website performs in dev and prod.
(function () {
  // Check if we're in a local development environment
  const isLocalDev = window.location.hostname === 'localhost' || window.location.hostname === '127.0.0.1';

  console.log('isLocalDev', isLocalDev);
  var webSdkScript = document.createElement("script");

  // fetch the latest version of the Web-SDK from the CDN
  webSdkScript.src =
    "https://unpkg.com/@grafana/faro-web-sdk@^1.4.0/dist/bundle/faro-web-sdk.iife.js";

  webSdkScript.onload = () => {
    // Configure Faro differently based on environment
    const faroConfig = {
      url: "https://faro-collector-prod-us-east-0.grafana.net/collect/...",
      app: {
        name: "blog",
        version: "1.0.0",
        environment: isLocalDev ? "development" : "production",
      }
    };

    // Add transport configuration for local development to handle CORS
    if (isLocalDev) {
      faroConfig.transport = {
        mode: 'no-cors'
      };
    }

    // Initialize Faro with the appropriate configuration
    window.GrafanaFaroWebSdk.initializeFaro(faroConfig);

    // Load instrumentations at the onLoad event of the web-SDK and after the above configuration.
    // This is important because we need to ensure that the Web-SDK has been loaded and initialized before we add further instruments!
    var webTracingScript = document.createElement("script");

    // fetch the latest version of the Web Tracing package from the CDN
    webTracingScript.src =
      "https://unpkg.com/@grafana/faro-web-tracing@^1.4.0/dist/bundle/faro-web-tracing.iife.js";

    // Initialize, configure (if necessary) and add the the new instrumentation to the already loaded and configured Web-SDK.
    webTracingScript.onload = () => {
      window.GrafanaFaroWebSdk.faro.instrumentations.add(
        new window.GrafanaFaroWebTracing.TracingInstrumentation()
      );
    };

    // Append the Web Tracing script script tag to the HTML page
    document.head.appendChild(webTracingScript);
  };

  // Append the Web-SDK script script tag to the HTML page
  document.head.appendChild(webSdkScript);
})();
What else does Faro do
I don’t really know.
And in most ways, that’s because I’m not a frontend developer – but I do know that Faro allows you to further instrument your application for error tracking and custom signals. And yet, I am a frontend developer, I just don’t prefer it and so work on it begrudgingly. Although I love me some HTML.
In contexts where people care, Faro instrumentation enables things like conversion funnel analysis, feature usage tracking, A/B testing, monitoring and alerting longer API response times, feature adoption, etc.
If that’s you and you want something to help you do that, I suggest Grafana Faro.

About michaellamb.dev
Michael Lamb is a software engineer working at C Spire. If you have a blog-specific inquiry please create a new issue on GitHub. Feel free to fork this blog and build your own!Get to know who I am in my first post Hello, World!